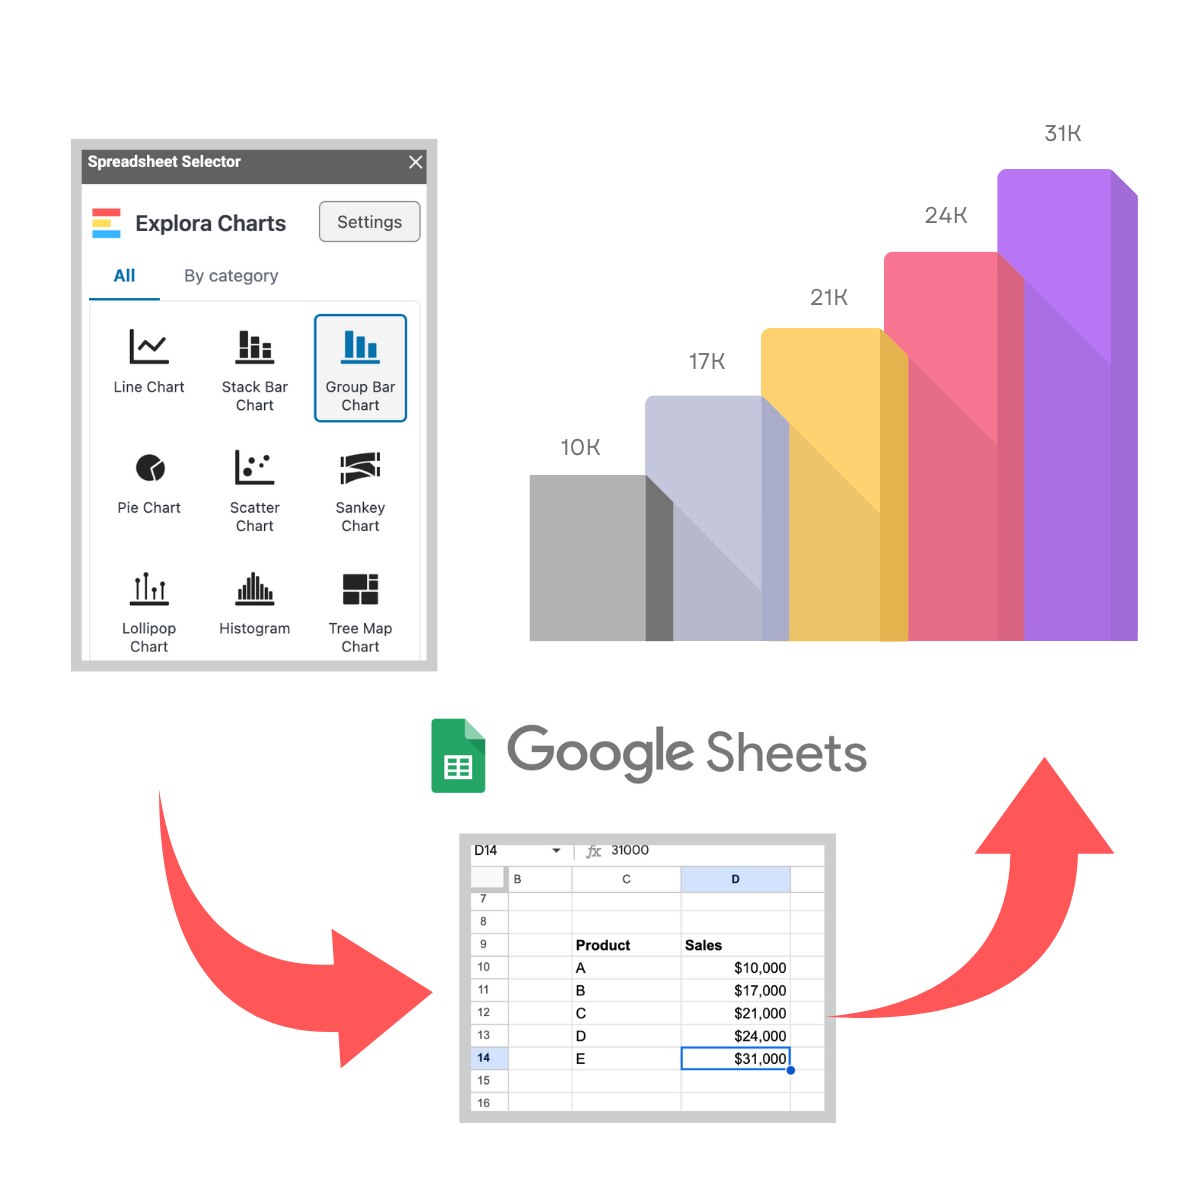
ExploraBI Automation Logo
Automate Google Sheets™ in seconds
Select triggers, actions, and conditions to automate your workflows.

The most powerful automation extension for Google Sheets™

  • Powerful triggers and actions
  • Email notifications and webhooks
  • Scheduled automations
  • Conditional logic and workflows
  • And many more!

ExploraBI Automation

React to spreadsheet changes instantly

  • Sheet Change Triggers - Monitor cells, rows, or columns
  • Schedule Triggers - Run automations daily, weekly, monthly
  • Conditional Logic - Advanced AND/OR conditions
  • Real-time monitoring and responses

ExploraBI Automation

Automate any spreadsheet task

  • Update cells automatically
  • Send email notifications
  • Copy data between sheets
  • Sort and organize data
  • Delete old records
  • HTTP requests and webhooks

Powerful Actions

Stay informed with automatic notifications

  • Get notified when data changes
  • Customizable email templates
  • Dynamic content from your sheets
  • Multiple recipients support

Email Notifications

Run automations on your schedule

  • Daily, weekly, monthly schedules
  • Automated reports and summaries
  • Data cleanup and maintenance
  • Time-based workflows

Scheduled Automations

Connect with external services

  • Webhook support for real-time data sync
  • HTTP requests to external APIs
  • Integration with business systems
  • Custom data workflows

External Integrations
ExploraBI Automation Logo

ExploraBI Automation for Google Sheets™

Automate your workflows right now!

Learn Data Transformation and Automation

View all posts »

This is your go-to guide for understanding spreadsheet automation and data workflows. Each article will help you build your knowledge, making complex automation concepts simple and clear. Whether you're just getting started or looking to improve your automation skills, you'll find practical tips and tutorials to help you become confident in automating your spreadsheet tasks effectively.

Sankey Charts: How to Tell a Flowing Story with Your Data

Sankey Charts: How to Tell a Flowing Story with Your Data

We’ll explore the power of Sankey charts, a unique type of data visualization designed to display flows or transfers between categories. Learn how to use Sankey charts to tell a compelling story by visualizing the movement of data.